
List of Unsold Condo Units in Singapore 2023
To date, there are only 16,024 unsold condo units in Singapore.
Due to the robust en bloc sales that took place between 2017 till the 1st half of 2018, homebuyers and investors will likely be overwhelmed by the huge number of new launch (or uncompleted) projects which are available in the market right now.
However, a huge portion of the supply has been absorbed by the market since late 2020.
According to the Urban Redevelopment Authority (URA) of Singapore, the total number of uncompleted private homes (excluding executive condos) in the pipeline works out to be a whopping 46,041 by the end of Q4 2022.
In Q3 2022, the number was 49,384 - which means 3,343 uncompleted homes have been added to the impending supply.
The encouraging part is that the take-up rates are growing as fast, if not faster than the supply piling up.
By the end of Q4 2022, the number of unsold condo units tallies up to only 16,024 - which is up from the 15,677 units recorded in the previous quarter.
In short, only 347 units were added within a span of 3 months. Honestly. that’s not a lot.
If you were to include the number of unsold executive condo units as well, here’s how the supply numbers will look for the next couple of years.
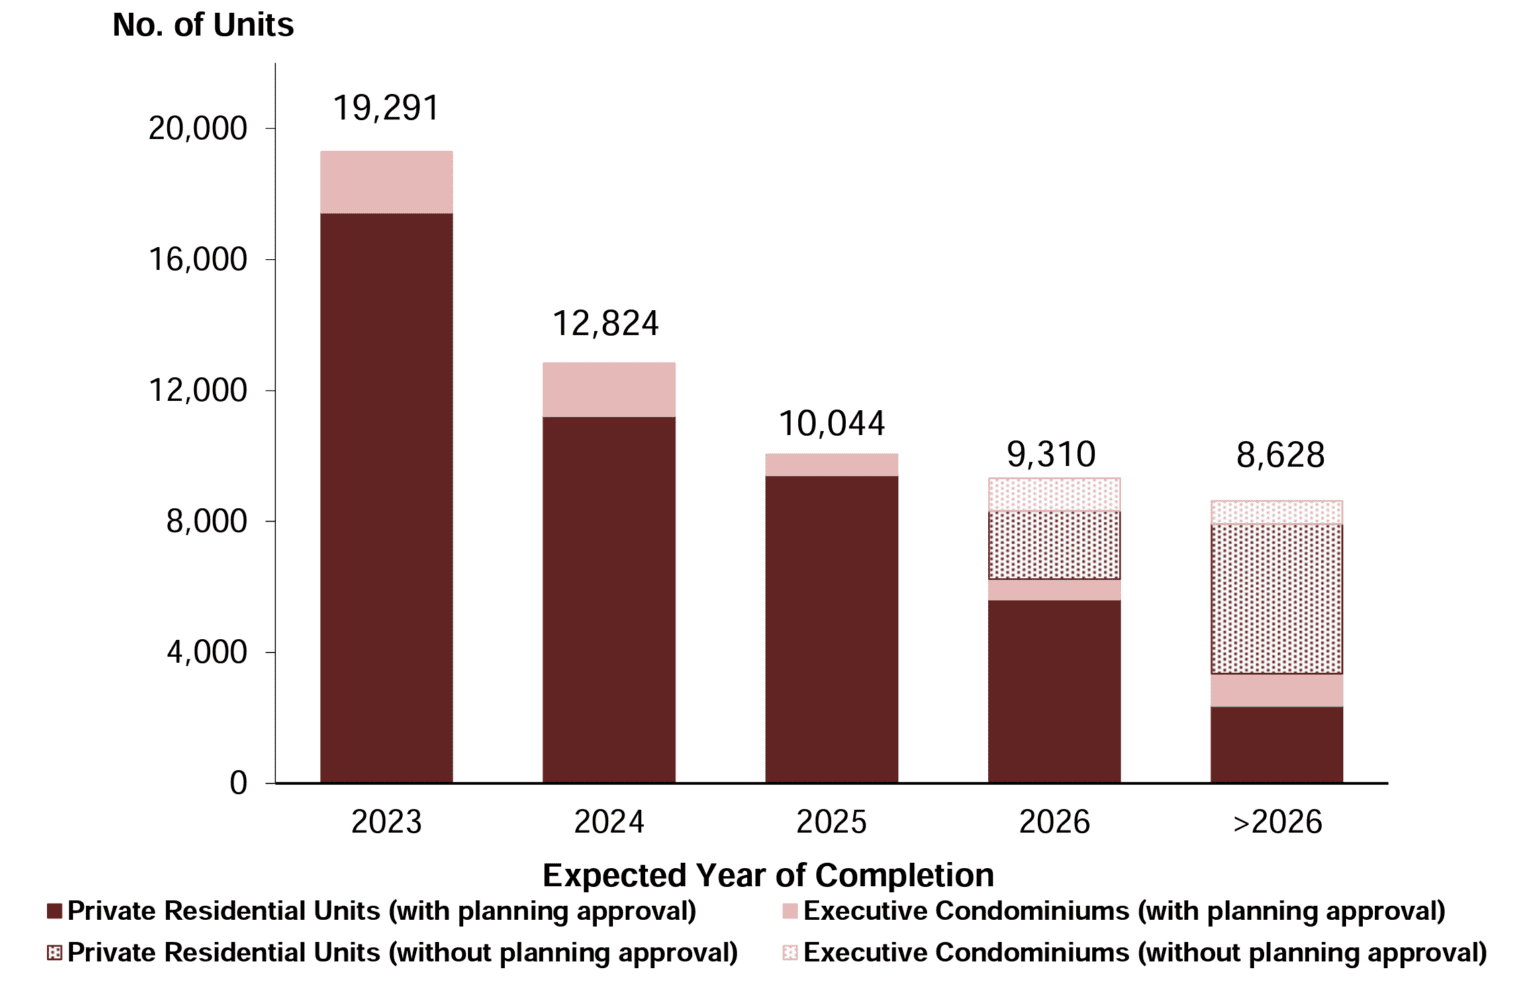
| Expected Year of Completion |
Private Residential Units |
Executive Condominiums |
Total Units |
| 2023 | 17,427 | 1,864 | 19,291 |
| 2024 | 11,215 | 1,609 | 12,824 |
| 2025 | 9,405 | 639 | 10,044 |
| 2026 | 7,702 | 1,608 | 9,310 |
| > 2026 | 6,952 | 1,676 | 8,628 |
| Total | 47,715 | 4,718 | 56,803 |
Learning from historical trends
In case you are wondering why was there a ‘craze’ in the collective sale market and the period when homebuyers and investors were on a buying spree, here’s a chart from URA showing the total number of unsold condo units since 2Q 2014.
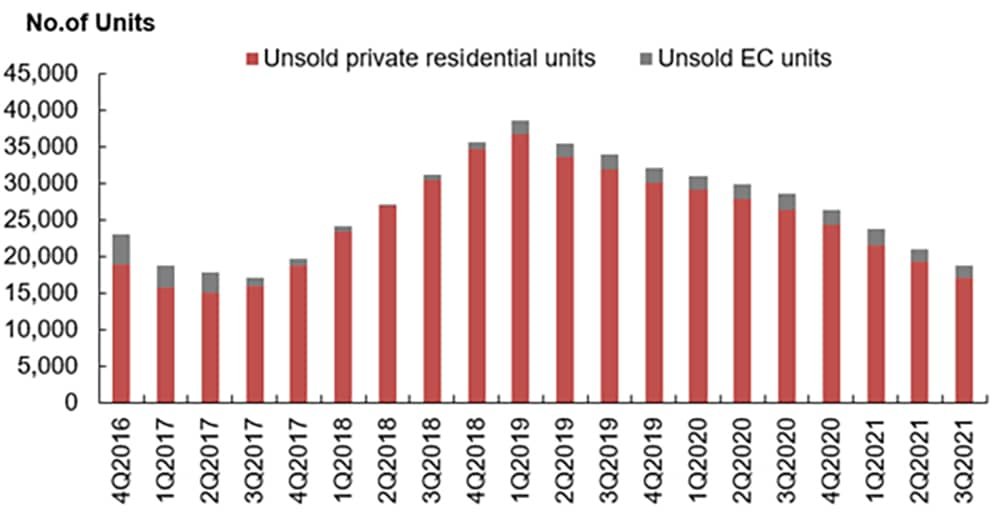
The supply of private homes and ECs was at the lowest point from the start of 2017.
As a result, developers were heavily bulking up their land banks with multiple land acquisitions between 2017 to 2018.
However, the government has put a stop to this frenzy by introducing a new round of property cooling measures back in July 2018 and reducing the land supply in the latest government land sales (GLS) programme.
Let’s look at the latest chart provided by URA.
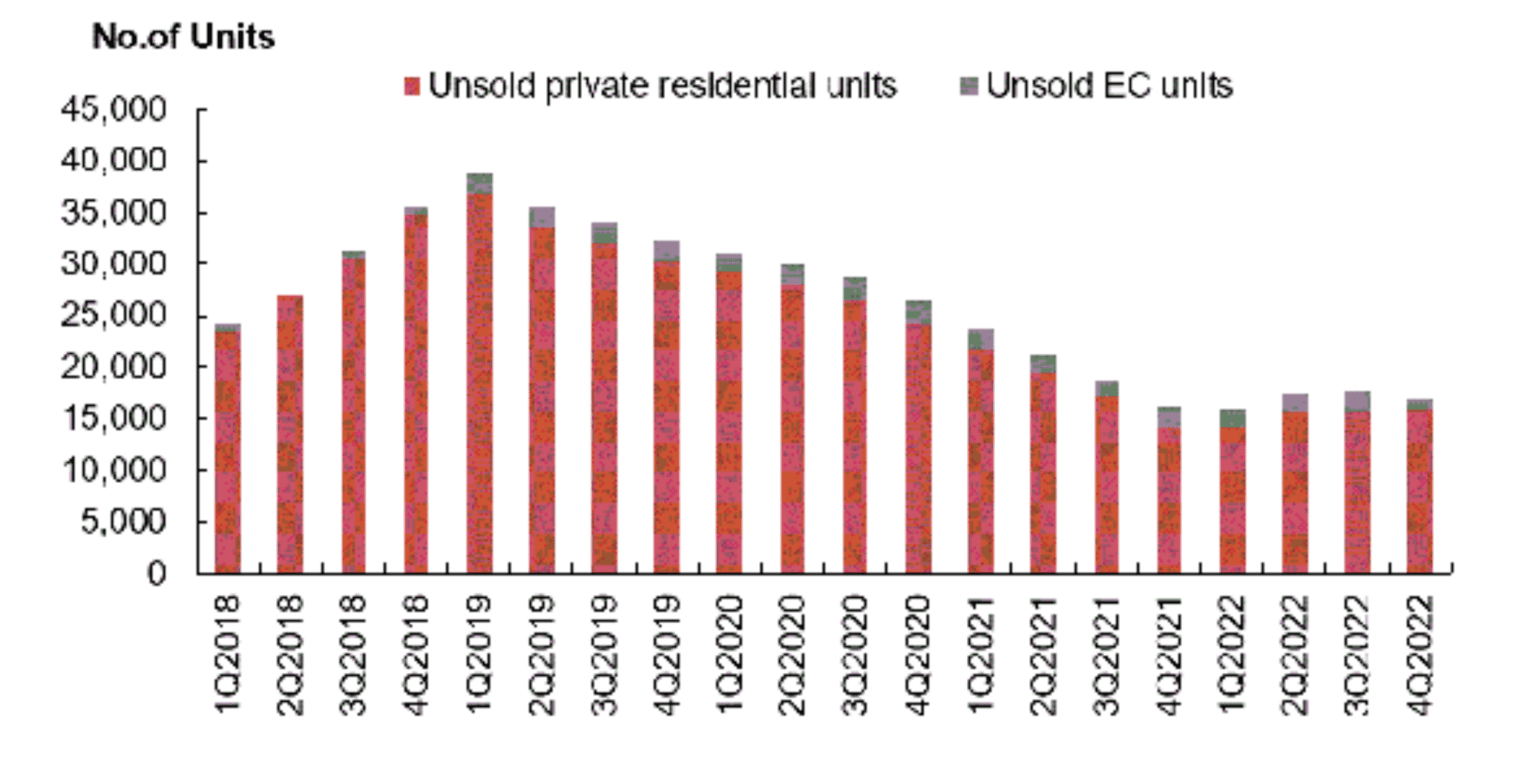
Thus, over the last couple of years, we saw a repeat of 2014 - 2016 when the property market was filled with unsold condo units.
That was actually the time period when developers were very conservative with their price points and dare not make significant price increments.
Obviously, that was perhaps the best time for buyers to enter the market before the next uptrend (when the housing supply runs low again), which technically is the current market situation.
Based on the rightful trend, we should have seen a huge influx of land sales and en bloc sales between 2021 to 2022.
It did look like we will repeat the 2017 - 2018 frenzy until the Singapore government stepped in with property cooling measures in Dec 2021.
Otherwise, we would be seeing many more unsold condo units projected for 2023 and 2024.
And when supply is heading south and demand is heading north, it’s natural to trigger more buying interest at this point of the trend.
Hence, now is possibly the best time (or even the last chance) to hedge onto the next upcycle by tapping on developers’ old stock of unsold condo units in Singapore.
The list of unsold condo units in Singapore
With an impending surge of new private homes in Singapore this year, I’ve prepared a list of unsold condo units in Singapore for 2023 and it will be updated monthly.
I believe this will help you to source the best deal during this property-buying spree.
Instead of looking at the full list of unsold condo units in Singapore (updated on 28 February 2023), I’ve broken it down into the 3 different regions or localities:
- Core Central Region or CCR (downtown central and high-end districts)
- Rest of Core Central Region or RCR (city fringe locations)
- Outside Central Region or OCR (mainly mass-market and suburban areas)
The list consists of developer sales for the whole of January 2023. It is sorted accordingly to the number of units sold within the latest month.
I guess it’s a good indication of the popularity of each of the condo projects and what homebuyers and property investors are paying for.
Unsold Condo Units in CCR
| Project Name | Street Name | Total No. of Units | Sales for Jan 23 | Total Unsold Units |
Average Price (PSF)* |
| LEEDON GREEN | LEEDON HEIGHTS | 638 | 21 | 115 | $2,957 |
| KLIMT CAIRNHILL | CAIRNHILL ROAD | 138 | 17 | 113 | $3,784 |
| ONE HOLLAND VILLAGE RESIDENCES | HOLLAND VILLAGE WAY | 296 | 16 | 47 | $2,791 |
| HAUS ON HANDY | HANDY ROAD | 188 | 11 | 21 | $2,746 |
| PERFECT TEN | BUKIT TIMAH ROAD | 230 | 11 | 43 | $3,168 |
| WILSHIRE RESIDENCES | FARRER ROAD | 85 | 10 | 11 | $2,716 |
| CAIRNHILL 16 | CAIRNHILL RISE | 39 | 8 | 29 | $2,675 |
| HYLL ON HOLLAND | HOLLAND ROAD | 319 | 8 | 68 | $2,788 |
| PULLMAN RESIDENCES NEWTON | DUNEARN ROAD | 340 | 8 | 120 | $3,092 |
| MIDTOWN MODERN | TAN QUEE LAN STREET | 558 | 6 | 85 | $2,920 |
| PEAK RESIDENCE | THOMSON ROAD | 90 | 6 | 39 | $2,553 |
| SLOANE RESIDENCES | BALMORAL ROAD | 52 | 5 | 0 | $2,598 |
| IRWELL HILL RESIDENCES | IRWELL HILL | 540 | 3 | 31 | $2,999 |
| ONE BERNAM | BERNAM STREET | 351 | 3 | 207 | $2,480 |
| VAN HOLLAND | HOLLAND ROAD | 69 | 3 | 25 | $2,931 |
| 19 NASSIM | NASSIM HILL | 101 | 2 | 95 | $3,846 |
| JERVOIS PRIVE | JERVOIS ROAD | 43 | 2 | 38 | $2,902 |
| KOPAR AT NEWTON | MAKEWAY AVENUE | 378 | 2 | 28 | $2,436 |
| MIDTOWN BAY | BEACH ROAD | 219 | 2 | 124 | $3,237 |
| THE ATELIER | MAKEWAY AVENUE | 120 | 2 | 98 | $2,814 |
| THE M | MIDDLE ROAD | 522 | 2 | 24 | $3,190 |
| 10 EVELYN | EVELYN ROAD | 56 | 1 | 36 | $2,756 |
| BOULEVARD 88 | ORCHARD BOULEVARD | 154 | 1 | 19 | $3,882 |
| DALVEY HAUS | DALVEY ROAD | 17 | 1 | 12 | $3,493 |
| GRANGE 1866 | GRANGE ROAD | 60 | 1 | 48 | $3,145 |
| HILL HOUSE | INSTITUTION HILL | 72 | 1 | 58 | $3,022 |
| MOOI RESIDENCES | HOLLAND ROAD | 24 | 1 | 1 | $2,568 |
| NEU AT NOVENA | MOULMEIN RISE | 87 | 1 | 6 | $2,970 |
| PARK NOVA | TOMLINSON ROAD | 54 | 1 | 7 | $4,642 |
| PARKSUITES | HOLLAND GROVE ROAD | 119 | 1 | 89 | $2,173 |
| THE AVENIR | RIVER VALLEY CLOSE | 376 | 1 | 38 | $3,162 |
| 15 HOLLAND HILL | HOLLAND HILL | 57 | 0 | 5 | - |
| 35 GILSTEAD | GILSTEAD ROAD | 70 | 0 | 2 | - |
| ASPEN LINQ | INSTITUTION HILL | 18 | 0 | 1 | - |
| CUSCADEN RESERVE | CUSCADEN ROAD | 192 | 0 | 182 | - |
| DUNEARN 386 | DUNEARN ROAD | 35 | 0 | 0 | - |
| ENCHANTE | EVELYN ROAD | 25 | 0 | 23 | - |
| FOURTH AVENUE RESIDENCES | FOURTH AVENUE | 476 | 0 | 0 | - |
| FYVE DERBYSHIRE | DERBYSHIRE ROAD | 71 | 0 | 0 | - |
| IKIGAI | SHREWSBURY ROAD | 16 | 0 | 11 | - |
| JERVOIS MANSION | JERVOIS CLOSE | 130 | 0 | 26 | - |
| JERVOIS TREASURES | JERVOIS ROAD | 36 | 0 | 34 | - |
| LES MAISONS NASSIM | NASSIM ROAD | 14 | 0 | 3 | - |
| ONE DRAYCOTT | DRAYCOTT PARK | 64 | 0 | 51 | - |
| RESIDENTIAL APARTMENTS | SHENTON WAY | 215 | 0 | 215 | - |
| RESIDENTIAL APARTMENTS | CAIRNHILL RISE | 75 | 0 | 75 | - |
| [email protected] | SURREY ROAD | 38 | 0 | 38 | - |
| SOPHIA REGENCY | SOPHIA ROAD | 38 | 0 | 38 | - |
| THE HYDE | BALMORAL ROAD | 117 | 0 | 2 | - |
| THE IVERIA | KIM YAM ROAD | 51 | 0 | 0 | - |
| BOTANIC @ CLUNY PARK | CLUNY PARK ROAD | 6 | 0 | 3 | - |
Unsold Condo Units in RCR
| Project Name | Street Name | Total No. of Units | Sales for Jan 23 | Total Unsold Units |
Average Price (PSF)* |
| RIVIERE | JIAK KIM STREET | 455 | 13 | 34 | $3,087 |
| THE LANDMARK | CHIN SWEE ROAD | 396 | 10 | 179 | $2,555 |
| LIV @ MB | ARTHUR ROAD | 298 | 6 | 44 | $2,529 |
| ONE PEARL BANK | PEARL BANK | 774 | 4 | 66 | $2,587 |
| FORETT AT BUKIT TIMAH | TOH TUCK ROAD | 633 | 3 | 10 | $2,298 |
| 1953 | TESSENSOHN ROAD | 58 | 2 | 0 | $1,859 |
| BARTLEY VUE | JALAN BUNGA RAMPAI | 115 | 2 | 37 | $1,876 |
| THE REEF AT KING’S DOCK | HARBOURFRONT AVENUE | 429 | 2 | 30 | $2,608 |
| AMBER PARK | AMBER GARDENS | 592 | 1 | 10 | $2,784 |
| ATLASSIA | JOO CHIAT PLACE | 31 | 1 | 10 | $2,036 |
| CANNINGHILL PIERS | CLARKE QUAY | 696 | 1 | 20 | $3,002 |
| MORI | GUILLEMARD ROAD | 137 | 1 | 12 | $1,835 |
| PICCADILLY GRAND | NORTHUMBERLAND ROAD | 407 | 1 | 62 | $1,801 |
| ROYAL HALLMARK | HAIG LANE | 32 | 1 | 12 | $1,999 |
| AMBER SEA | AMBER GARDENS | 132 | 0 | 132 | - |
| AVENUE SOUTH RESIDENCE | SILAT AVENUE | 1074 | 0 | 0 | - |
| CLAYDENCE | STILL ROAD/KOON SENG ROAD | 28 | 0 | 28 | - |
| COASTLINE RESIDENCES | AMBER ROAD | 144 | 0 | 0 | - |
| GEMS VILLE | LORONG 13 GEYLANG | 24 | 0 | 24 | - |
| JADESCAPE | SHUNFU ROAD | 1206 | 0 | 0 | - |
| LAVENDER RESIDENCE | LAVENDER STREET | 17 | 0 | 17 | - |
| MATTAR RESIDENCES | MATTAR ROAD | 26 | 0 | 26 | - |
| MAYFAIR GARDENS | RIFLE RANGE ROAD | 215 | 0 | 1 | - |
| MAYFAIR MODERN | RIFLE RANGE ROAD | 171 | 0 | 0 | - |
| MEYER MANSION | MEYER ROAD | 200 | 0 | 9 | - |
| MYRA | MEYAPPA CHETTIAR ROAD | 85 | 0 | 21 | - |
| NYON | AMBER ROAD | 92 | 0 | 0 | - |
| ONE MEYER | MEYER PLACE | 66 | 0 | 0 | - |
| PARK COLONIAL | WOODLEIGH LANE | 805 | 0 | 5 | - |
| SERAYA RESIDENCES | SERAYA LANE | 17 | 0 | 3 | - |
| SKY EVERTON | EVERTON ROAD | 262 | 0 | 1 | - |
| SUNSTONE HILL | BALMEG HILL | 28 | 0 | 28 | - |
| TEMBUSU GRAND | JALAN TEMBUSU | 638 | 0 | 638 | - |
| TERRA HILL | YEW SIANG ROAD | 270 | 0 | 270 | - |
| THE WOODLEIGH RESIDENCES | BIDADARI PARK DRIVE | 667 | 0 | 0 | - |
| UPTOWN @ FARRER | PERUMAL ROAD | 116 | 0 | 1 | - |
| VERTICUS | JALAN KEMAMAN | 162 | 0 | 0 | - |
| ZYANYA | LORONG 25A GEYLANG | 34 | 0 | 14 | - |
| KENT RIDGE HILL RESIDENCES | SOUTH BUONA VISTA ROAD | 548 | 0 | 3 | - |
| NORMANTON PARK | NORMANTON PARK | 1862 | 0 | 0 | - |
Unsold Condo Units in OCR
| Project Name | Street Name | Total No. of Units | Sales for Jan 23 | Total Unsold Units |
Average Price (PSF)* |
| SCENECA RESIDENCE | TANAH MERAH KECHIL LINK | 268 | 157 | 111 | $2,083 |
| TENET | TAMPINES STREET 62 | 618 | 145 | 28 | $1,388 |
| THE GAZANIA | HOW SUN DRIVE | 250 | 9 | 32 | $2,306 |
| COPEN GRAND | TENGAH GARDEN WALK | 639 | 8 | 0 | $1,408 |
| PARC CLEMATIS | JALAN LEMPENG | 1468 | 7 | 21 | $1,801 |
| NORTH GAIA | YISHUN CLOSE | 616 | 6 | 403 | $1,253 |
| SKY [email protected] | BEDOK CENTRAL | 158 | 2 | 34 | $2,072 |
| THE COMMODORE | CANBERRA DRIVE | 219 | 2 | 7 | $1,471 |
| THE LILIUM | HOW SUN ROAD | 80 | 2 | 23 | $2,255 |
| URBAN TREASURES | JALAN EUNOS | 237 | 2 | 13 | $2,060 |
| BAYWIND RESIDENCES | LORONG N TELOK KURAU | 24 | 1 | 6 | $2,080 |
| KOVAN JEWEL | KOVAN ROAD | 34 | 1 | 29 | $2,126 |
| THE WATERGARDENS AT CANBERRA | CANBERRA DRIVE | 448 | 1 | 4 | $1,498 |
| PARC CANBERRA | CANBERRA WALK | 496 | 0 | 1 | - |
| PARC CENTRAL RESIDENCES | TAMPINES STREET 86 | 700 | 0 | 0 | - |
| PARC GREENWICH | FERNVALE LANE | 496 | 0 | 1 | - |
| PIERMONT GRAND | SUMANG WALK | 820 | 0 | 0 | - |
| PROVENCE RESIDENCE | CANBERRA CRESCENT | 413 | 0 | 0 | - |
| 77 @ EAST COAST | UPPER EAST COAST ROAD | 41 | 0 | 0 | - |
| AMO RESIDENCE | ANG MO KIO RISE | 372 | 0 | 5 | - |
| CASA AL MARE | JALAN LOYANG BESAR | 49 | 0 | 0 | - |
| CLAVON | CLEMENTI AVENUE 1 | 640 | 0 | 0 | - |
| DAIRY FARM RESIDENCES | DAIRY FARM LANE | 460 | 0 | 1 | - |
| INFINI AT EAST COAST | EAST COAST ROAD | 36 | 0 | 0 | - |
| K SUITES | LORONG K TELOK KURAU | 19 | 0 | 19 | - |
| KI RESIDENCES AT BROOKVALE | BROOKVALE DRIVE | 660 | 0 | 23 | - |
| LENTOR MODERN | LENTOR CENTRAL | 605 | 0 | 84 | - |
| M SUITES | LORONG MELAYU | 16 | 0 | 0 | - |
| MONT BOTANIK RESIDENCE | JALAN REMAJA | 108 | 0 | 0 | - |
| PARC KOMO | UPPER CHANGI ROAD NORTH | 276 | 0 | 0 | - |
| PARKWOOD RESIDENCES | YIO CHU KANG ROAD | 18 | 0 | 0 | - |
| PASIR RIS 8 | PASIR RIS DRIVE 8 | 487 | 0 | 24 | - |
| PHOENIX RESIDENCES | PHOENIX AVENUE | 74 | 0 | 4 | - |
| RESIDENCE TWENTY-TWO | TELOK KURAU ROAD | 22 | 0 | 0 | - |
| RYMDEN 77 | LORONG H TELOK KURAU | 31 | 0 | 1 | - |
| SENGKANG GRAND RESIDENCES | COMPASSVALE BOW | 680 | 0 | 0 | - |
| THE ARDEN | PHOENIX ROAD | 105 | 0 | 105 | - |
| THE BOTANY AT DAIRY FARM | DAIRY FARM WALK | 386 | 0 | 386 | - |
| THE FLORENCE RESIDENCES | HOUGANG AVENUE 2 | 1410 | 0 | 0 | - |
| BELGRAVIA ACE | BELGRAVIA DRIVE | 107 | 0 | 25 | - |
| PARKWOOD COLLECTION | LORONG 1 REALTY PARK | 53 | 0 | 0 | - |
| AFFINITY AT SERANGOON | SERANGOON NORTH AVENUE 1 | 1052 | 0 | 8 | - |
| RIVERFRONT RESIDENCES | HOUGANG AVENUE 7 | 1472 | 0 | 1 | - |
If you would like to receive the full monthly-updated list of unsold condo units in Singapore and other updates via email, simply just indicated your interest by using the form below.
Final Word
Let’s face it - when the Singapore property market was experiencing a downturn back from 2014 to 2016, many homebuyers or investors were thinking that the market was going to crash and thus hoping to rip a good deal (or a cheap one) from sellers or developers.
Unfortunately, that did not happen as frequently as most would hope for.
Similar sentiments were felt over the last 2 years when the nation was affected by the COVID-19 pandemic.
However, prices remain strong in the new homes segment and the buying demand keeps increasing.
In fact, by looking at the current price points of these developments with unsold condo units in Singapore, you will never be able to find anything that matches the price points which were seen in 2014 - 2016.
In my opinion, there’s absolutely no rush to buy into the new launch property market right now.
This is because we are expecting more projects to be released in 2023 & 2024, and I believe they will be listed for sale at very competitive price points due to supply in the market.
Hence, you can take your time within these 2 years to pick the right one that suits your needs as it is the most ideal window to purchase a new launch condo.
I am not saying that all of these unsold condos listed are all good buys, but it certainly helps if you study this list over time as I continue to update it.
Pick the one that matches your own requirements and one that fits you.
And if you need help or a real-time update on the condominium of your choice, you can always reach me via Whatsapp or drop me a note using the contact form below.
Thanks for reading and please help to share if you find this article useful.